
Despite a 17-day streak of institutional inflows, Solana has faced a critical technical breakdown. We explore the liquidity divergence and how smart money is hedging with PoW hardware.
The ETF Paradox: Institutional Demand vs. Market Reality
Institutional Conviction in a Bearish Trend
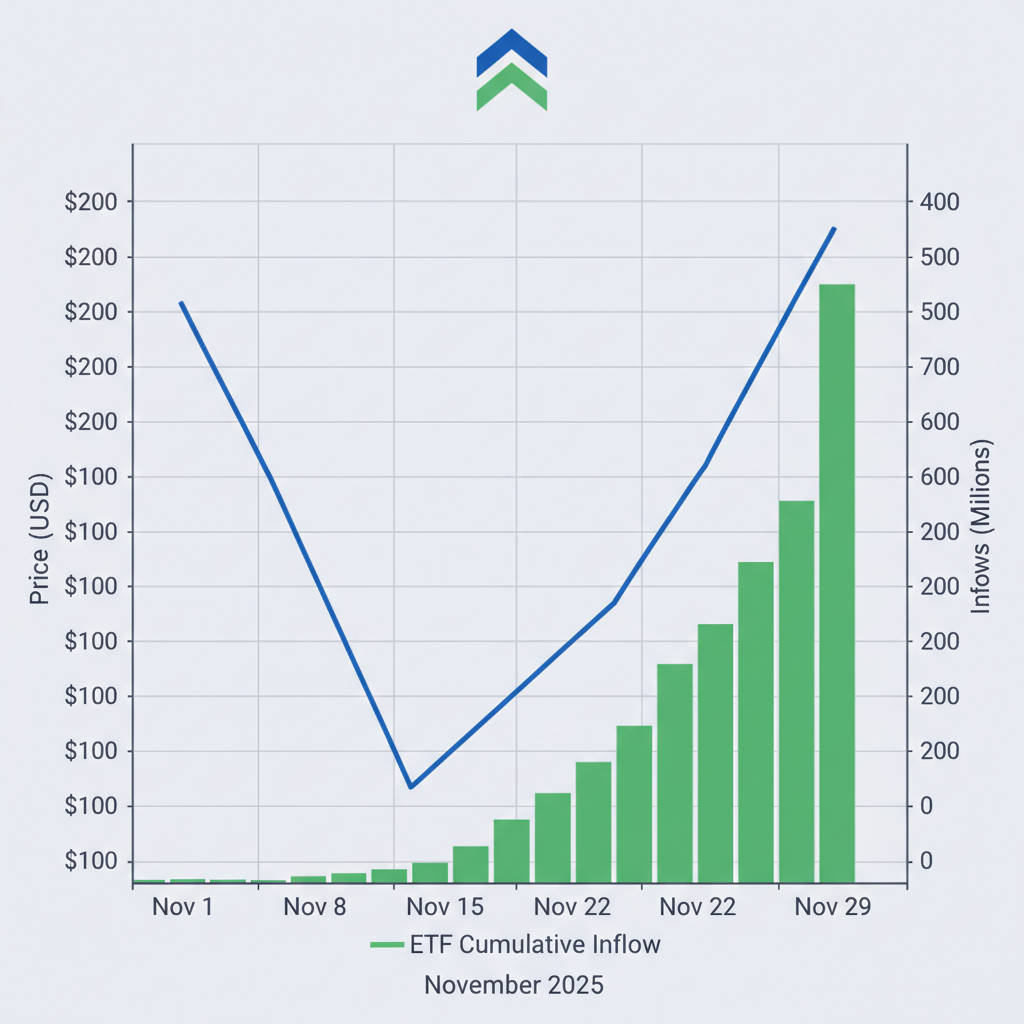
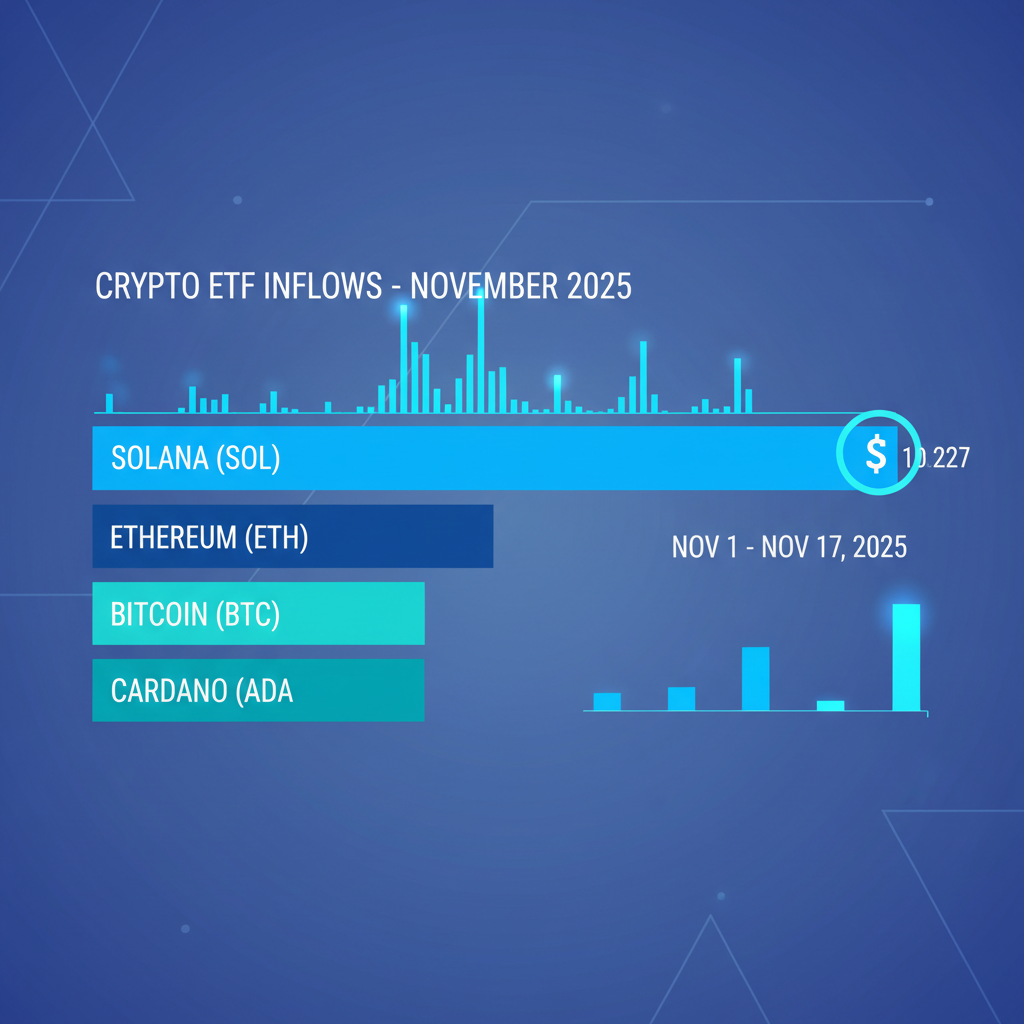
November 2025 presented one of the most perplexing divergences in recent cryptocurrency history. Solana (SOL) recorded a staggering 17-day streak of positive inflows into U.S. spot ETFs, accumulating nearly $476 million in fresh institutional capital. Products like Bitwise’s BSOL and Grayscale’s GSOL acted as massive liquidity sinks, absorbing over $48.5 million in a single Wednesday session alone. Yet, contrary to the laws of supply and demand, the price of SOL did not rally; instead, it decayed, shedding over 5% to trade well below the psychological $150 mark.
This phenomenon highlights a distinct separation between “smart money” accumulation and broader retail sentiment. While institutional vehicles were aggressively buying the dip, on-chain data suggests that legacy holders and validators were distributing coins at an even faster rate. The market is witnessing a transfer of ownership from weak hands—spooked by macro uncertainty and declining DEX volume—to long-term institutional custodians who view the $135–$145 range as a prime accumulation zone.
The Retail Exodus
While ETFs bought, the retail user base contracted. Daily active addresses on Solana plummeted to a 12-month low of roughly 3.3 million, a stark contrast to the 9 million peak seen earlier in the year. This metric is crucial for mining and infrastructure experts like Miners1688 because it signals a temporary cooling of the “memecoin mania” that fueled high gas fees and network activity. Without the constant churn of retail transactions, the speculative premium on SOL evaporated, leaving the price to find support based purely on utility and institutional holding power.
Technical Analysis: Anatomy of the $150 Breakdown
The $133 Defense Line
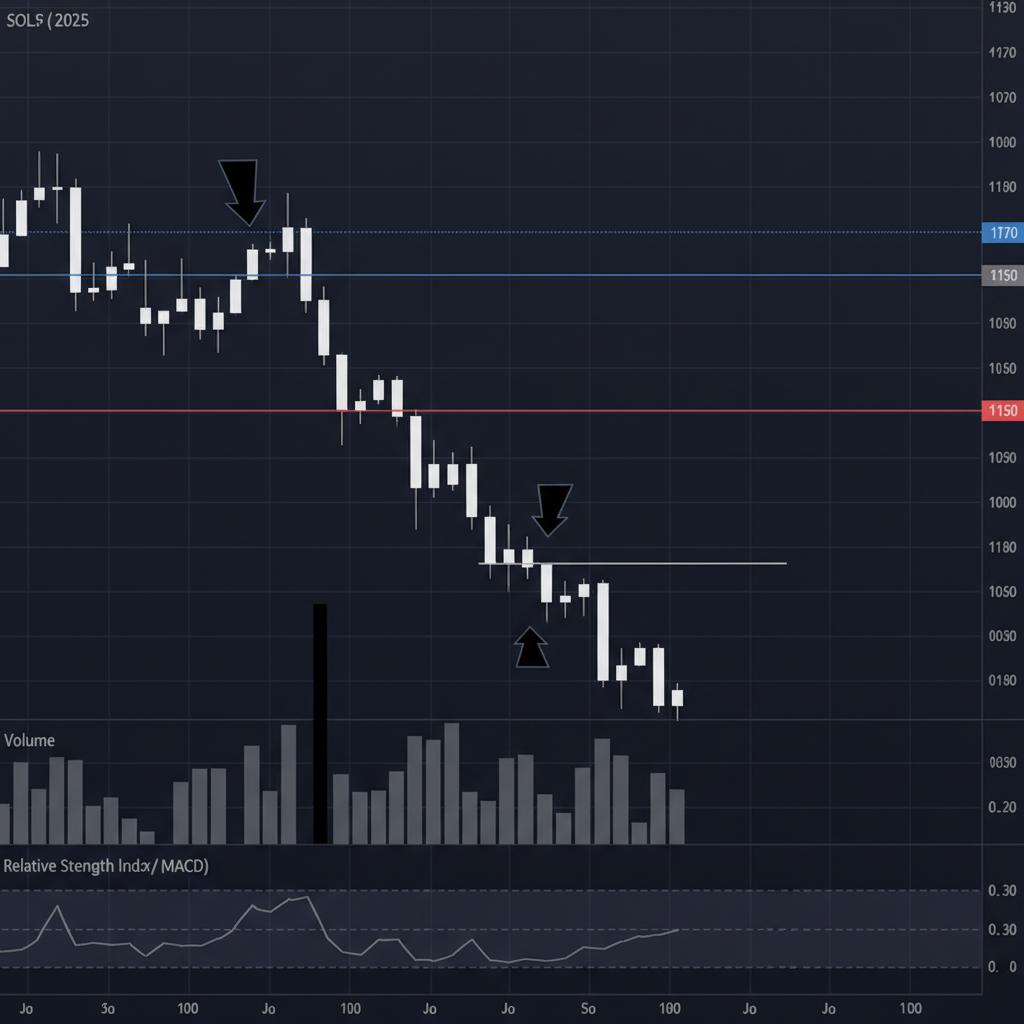
Technical traders watched in dismay as the $150 support level—previously a fortress for bulls—crumbled under heavy volume. The breakdown was not a slow bleed but a violent liquidation event, triggered by a cascade of stop-loss orders that pushed the price down to test the $133 region. This level is historically significant; it represents the “line in the sand” that separates a healthy correction from a potential bear market deep dive toward double digits.
However, the $133 zone has shown remarkable resilience. Buyers stepped in aggressively at these lows, forming a potential “double-bottom” pattern on the 4-hour charts. This structure often precedes a trend reversal. For the reversal to be confirmed, SOL needs to reclaim the $145 level on high volume, effectively turning previous support-turned-resistance back into a floor.
Volume Analysis and Recovery Targets
The drop was accompanied by a volume spike 13% above the weekly average, confirming the validity of the breakdown. In technical analysis, volume precedes price. The subsequent stabilization on lower volume indicates that the intense selling pressure has exhausted itself. The immediate target for a recovery is the $157.25 resistance band. A daily close above this level would invalidate the bearish “lower-high” structure and realign the technicals with the bullish ETF inflow data. Until then, caution is advised, and diversification into non-correlated assets like Bitcoin Miners remains a prudent strategy for risk management.
Staking Ecosystem: Yields, Inflation, and Policy Changes
Navigating Reduced Inflation Proposals
The Solana network is currently debating a pivotal governance proposal: SIMD-0411. This proposal aims to accelerate the reduction of staking rewards to curb inflation. Currently, staking rewards hover between 6% and 7%, but the new plan suggests doubling the inflation reduction rate from 15% to 30% annually. While this sounds bearish for stakers who rely on yield, it is fundamentally bullish for the asset’s scarcity. Reduced issuance means less sell pressure from validators in the open market.
For investors, this creates a complex landscape. Do you stake for the diminishing native yield, or do you seek “real yield” elsewhere? Below is a comparison of current staking options available to Solana holders in December 2025.
| Staking Method | Provider/Platform | Est. APY (Dec 2025) | Risk Profile |
|---|---|---|---|
| Native Staking | Independent Validators | 6.0% – 7.0% | Low |
| Liquid Staking | Jito (JitoSOL) | ~7.8% (incl. MEV) | Medium |
| ETF Staking | SOL Strategies | ~6.72% | Low |
| CEX Staking | Coinbase / Binance | ~5.0% | Counterparty |
Table 1: Comparative Analysis of Solana Staking Yields (Source: Miners1688 Research)
The Shift to “Real Yield”
As inflation rewards tighten, the narrative is shifting toward “Real Yield”—income generated from actual production rather than token emission. This is why many crypto-native funds are diversifying into ASIC Mining operations, which secure networks like Bitcoin and Kaspa through physical energy expenditure, providing a yield that is uncorrelated to Solana’s specific inflationary mechanics.
Liquidity Depth and Network Fundamentals
Stablecoins: The Bullish Divergence
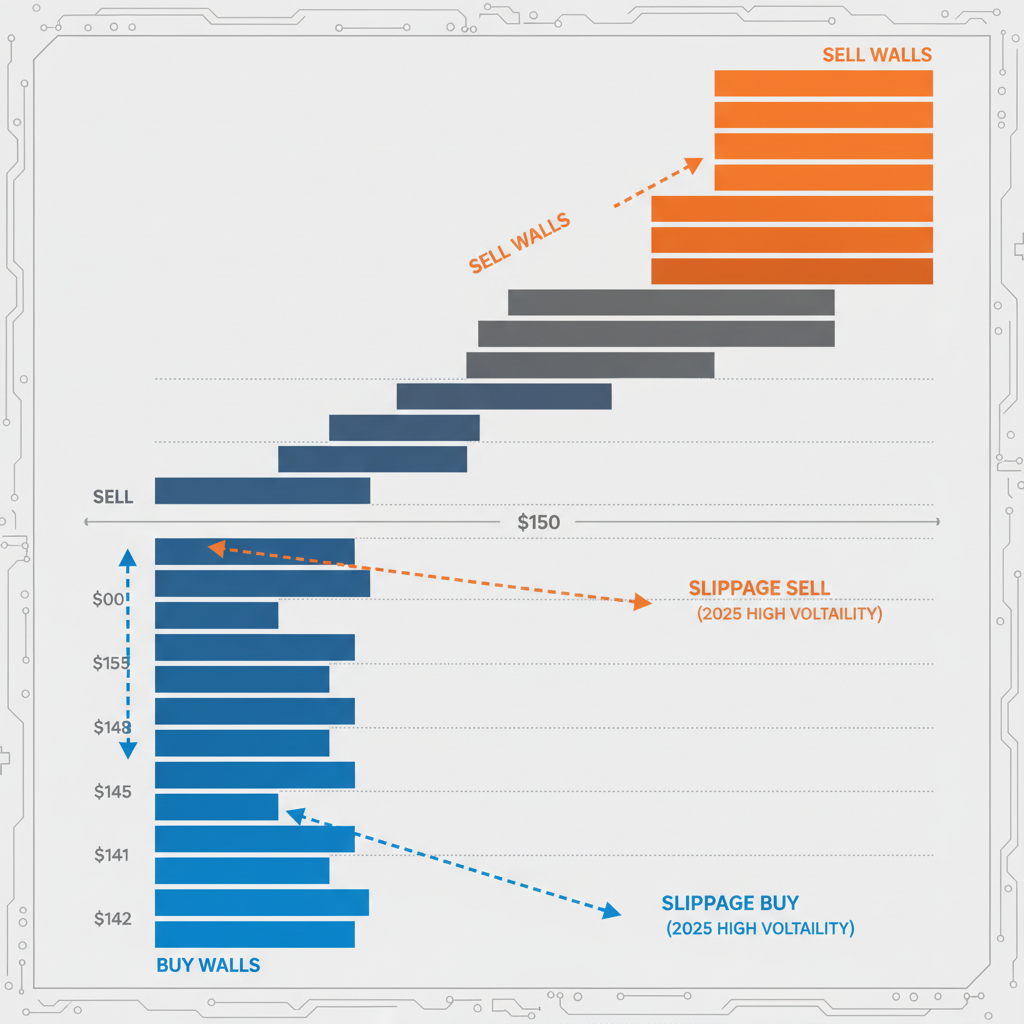
While the price chart looks bearish, the liquidity chart tells a different story. Stablecoin liquidity on Solana surged by over 13% in late November, reaching a staggering $15.18 billion. In the crypto ecosystem, stablecoins are the “dry powder” waiting to be deployed. A rising stablecoin market cap amidst falling asset prices is historically a very bullish signal—it implies that capital hasn’t left the ecosystem; it has simply moved to the sidelines, waiting for a trigger to re-enter.
On-Chain Activity Concerns
However, liquidity is only one piece of the puzzle. The decline in active addresses and DEX volumes cannot be ignored. For a network designed for high throughput and low latency, a drop in utilization strikes at its fundamental value proposition. Investors should closely monitor the “Total Value Locked” (TVL) in DeFi protocols. If TVL remains stable (as it largely has) while the token price drops, it suggests the ecosystem is fundamentally sound, and the price drop is a temporary dislocation caused by macro sentiment rather than a protocol failure.
PoS Consensus vs. PoW Mining: A Strategic Comparison
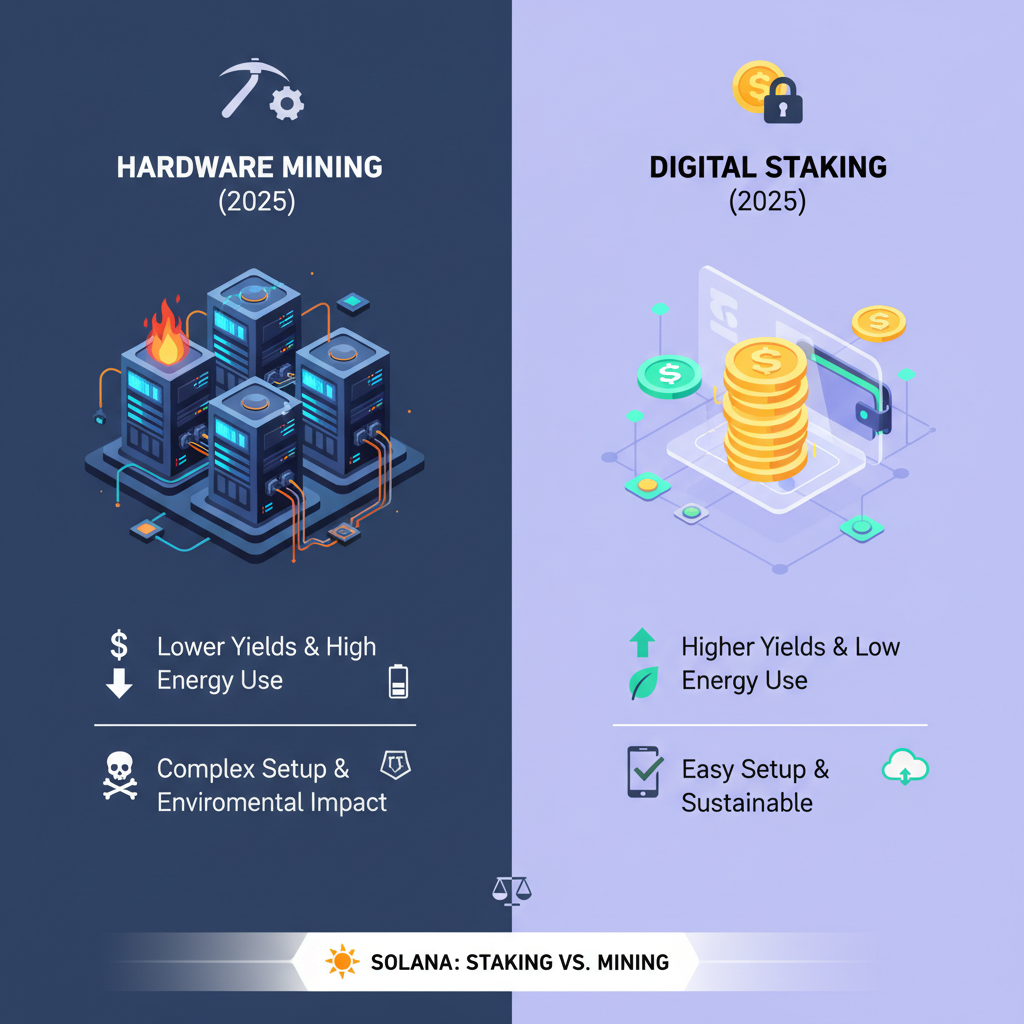
The Security Model Debate
Solana’s Proof-of-Stake (PoS) mechanism is celebrated for its energy efficiency, consuming a fraction of the power required by Proof-of-Work (PoW) chains. However, in 2025, sophisticated investors are realizing the value of physical diversification. While staking SOL offers yield, it increases exposure to the asset itself. In contrast, owning hardware like Kaspa Miners or LTC/DOGE Miners provides an income stream that is dependent on global energy markets and hardware efficiency, offering a robust hedge against pure token volatility.
Operational Economics
For those considering diversifying their crypto income, it is vital to understand the economic differences between running a validator node and operating a mining farm.
| Feature | Solana (Proof-of-Stake) | ASIC Mining (Proof-of-Work) |
|---|---|---|
| Entry Capital | Purchase of SOL tokens | Purchase of Hardware |
| OpEx (Running Cost) | Low (Server/Cloud costs) | High (Electricity & Cooling) |
| Yield Source | Inflationary Emission | Compute Production (Real Yield) |
| Asset Risk | High (Token Price Volatility) | Medium (Hardware Depreciation) |
| Optimization | Auto-compounding | Immersion Cooling |
Table 2: Economic Comparison: Staking vs. Industrial Mining
Why Not Both?
The most resilient portfolios in 2025 are those that balance these two worlds. They hold liquid PoS assets like Solana for capital appreciation and DeFi utility, while anchoring their cash flow with PoW hardware that prints value regardless of market sentiment.
Strategic Portfolio Balancing for 2026
Accumulation Zones and Stop Losses
Given the current data, the strategy for late 2025 is one of cautious accumulation. The $133–$140 zone presents a high reward-to-risk ratio for spot SOL purchases, assuming the $133 support holds. A breakdown below $120 would invalidate the bullish thesis, likely sending the asset toward $99. Investors should set strict invalidation points while Dollar Cost Averaging (DCA) into positions.
Infrastructure Plays Over Narratives
As the crypto market matures, the “infrastructure over narratives” thesis is gaining traction. This means investing in the base layers of the future economy. Solana represents the high-speed transaction layer, while Bitcoin and Kaspa represent the immutable settlement layers. By holding SOL and operating Bitcoin Miners, investors can capture value from the entire stack. At Miners1688, we believe that true crypto wealth is built by owning the means of production—whether that’s a validator node or an ASIC rig.
Frequently Asked Questions
Why is Solana dropping despite record ETF inflows?
While ETFs are buying, long-term holders and validators have been selling, creating a net supply surplus. Additionally, a drop in retail activity (active addresses) has reduced the speculative premium on the token.
Is the $150 support level permanently broken?
Not necessarily. In crypto, levels are often “reclaimed.” If SOL can close above $157.25 on high volume, the $150 breakdown will be viewed as a “bear trap.” However, until that happens, $150 acts as resistance.
Can I mine Solana with ASIC hardware?
No, Solana is a Proof-of-Stake network. You cannot mine it with hardware. To generate yield from hardware, you should look into Bitcoin Miners or Kaspa Miners.
What is the projected staking yield for 2026?
If proposal SIMD-0411 passes, nominal staking yields may decrease as inflation is cut. However, liquid staking protocols like Jito may maintain higher yields (~7-8%) by capturing MEV (Maximum Extractable Value) revenue.