
Introduction
The Bitcoin Rainbow Chart, our beacon in the volatile tides of cryptocurrency, guides us where complex algorithms, intricate data, and ceaseless market fluctuations might fail. This innovative tool turns unpredictable financial waves into an understandable spectrum of colors. With the Bitcoin Rainbow Chart, navigating the stormy seas of crypto trends becomes less about braving the unknown and more about interpreting the vivid array of hues in our financial landscape.
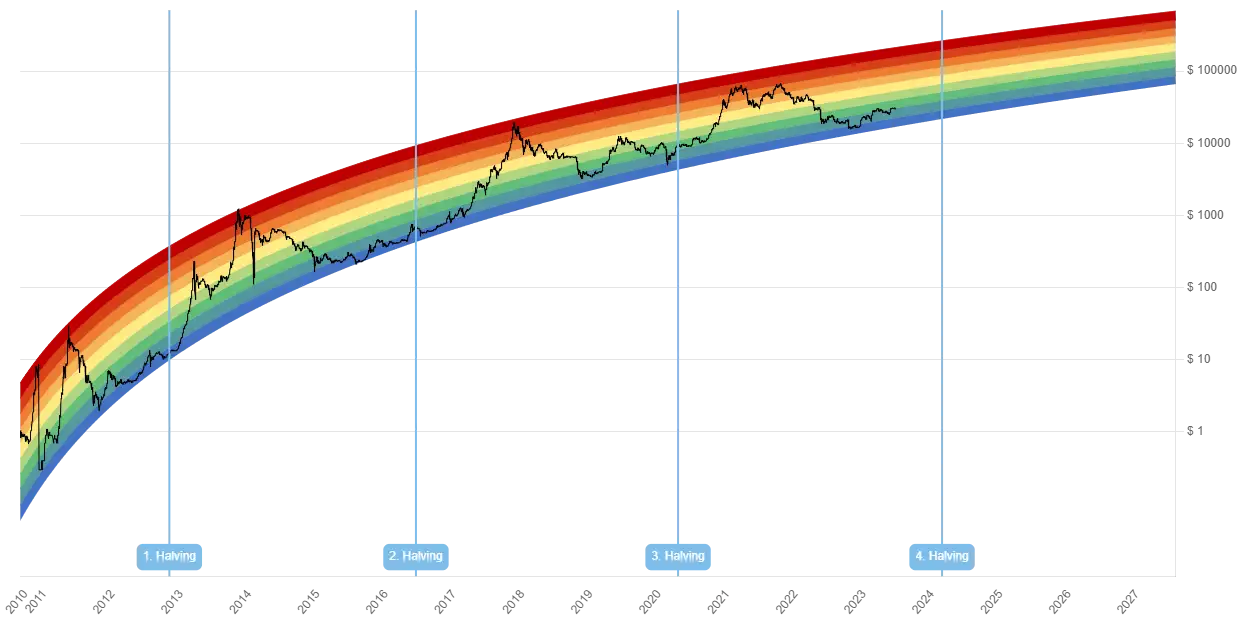
The Bitcoin Rainbow Chart is not just a visualization, it’s a narrative of Bitcoin’s journey, a storytelling arc bending from one extreme to the other, each color providing a chapter in the tale of Bitcoin’s price volatility. The warm red speaks of ‘Maximum Bubble Risk’, a cliff-edge from where a freefall is imminent. The cool purple, on the other hand, whispers ‘Still Cheap’, a valley of opportunities waiting to be explored.
But what does the current chapter tell us? In the pulse of the crypto markets, the question at the heart of every investor’s mind has been echoing louder – Has crypto bottomed? The Rainbow Chart, with its bold strokes of color, suggests we might be closer to the answer. The narrative it paints promises a fascinating exploration into the world of crypto investment, and that’s exactly what we’re going to dive into.
This article unravels the meaning behind the Bitcoin Rainbow Chart, decoding the significance of each hue, and analyzes the recent suggestions of a crypto bounce-back. So, buckle up as we embark on this exciting journey of color-coded finance, exploring the question – has crypto truly bottomed?
The Bitcoin Rainbow Chart
The Genesis of the Bitcoin Rainbow Chart
As the world of Bitcoin began its dramatic oscillations, traders found themselves in dire need of a tool that could simplify the complexity of price data. This led to the birth of the traders found themselves in dire need of a tool thatBitcoin Rainbow Chart. Not just a kaleidoscope of vibrant colors, this chart turned into a lighthouse in the stormy sea of crypto trading. It made its entrance, armed with the power to paint an abstract market into a tangible spectrum, and quickly became an essential navigation tool in the Bitcoin voyage.
The Significance of the Bitcoin Rainbow Chart
The Bitcoin Rainbow Chart isn’t merely a colorful infographic. It’s the embodiment of simplicity and strategy in a constantly evolving financial game. Each color in this visual marvel represents a phase of Bitcoin’s potential price bubble, helping traders quickly understand the state of the market. From the alarming red zone indicating ‘Maximum Bubble Risk’ to the calming purple assuring ‘Still Cheap’, each hue has a tale to tell. It’s these color-coded narratives that allow investors to make informed decisions in the labyrinthine world of crypto trading. traders quickly understand the state of the market. From the alarming red zone indicating ‘Maximum Bubble Risk’ to the calming purple assuring ‘Still Cheap’, each
How to Download the Bitcoin Rainbow Chart
But how does one acquire this chart? If the Rainbow Chart is our treasure map to Bitcoin’s fortunes, then consider the following steps as the keys to this treasure:
Step One: Search online for “Bitcoin Rainbow Chart pdf”. Multiple resources will pop up.
Step Two: Look for reliable sources among the search results, such as reputable financial or crypto trading websites.
Step Three: Once you’ve located a trustworthy source, look for a ‘Download’ button or link on the page.
Step Four: Click the ‘Download’ button, and the Bitcoin Rainbow Chart will start downloading in a pdf format.
Armed with this Rainbow Chart, you are now equipped to decode the complexities of the crypto market. You hold the map to navigate the Bitcoin landscape, painted in an array of colors, each telling their part in the ever-unfolding story of Bitcoin’s journey. Are you ready to plot your course?
Bitcoin Rainbow Price Chart
Decoding the Colors of the Bitcoin Rainbow Chart
A Colorful Guide to Bitcoin Trading
The Bitcoin Rainbow Chart presents a captivating spectacle. It’s an intertwining of art and data, each color dancing to the rhythm of Bitcoin’s price patterns. But what’s the melody behind each hue? What tales do they spin in the grand opera of cryptocurrency trading? Let’s pull back the curtain and explore each color’s narrative.
The Red Alert: “Maximum Bubble Risk”
Red—the color of urgency and danger. In the Bitcoin Rainbow Chart, it signifies the “Maximum Bubble Risk”. It’s a glaring warning to investors that Bitcoin’s price has soared into the clouds, and a steep descent might be imminent. It’s the sirens blaring, urging caution in trading decisions.
Orange and Yellow: “Sell” and “HODL!”
When the chart transitions into orange, it’s signaling a “Sell” alert. It’s the period where the Bitcoin ride might have peaked and a decline could be on the horizon. The time to consider liquidating your Bitcoin investments, perhaps?
Then comes yellow, a color associated with wisdom, and carrying the cryptic message “HODL!”. It’s an acronym born in the throes of a typo-infused crypto forum, meaning “Hold On for Dear Life”. Yellow is a testament to endurance, advising traders to hold onto their investments despite market fluctuations.
Green and Blue: “Accumulate” and “Buy”
As we move into the soothing shades of green, the chart suggests “Accumulate”. This is the phase where Bitcoin prices are deemed attractive for accumulation before the next potential upward swing.
Next, we wade into the calming waters of blue, a signal to “Buy”. It’s the optimal entry point for investors looking to ride the Bitcoin wave, a potentially fruitful time to dive into the crypto pool.
Purple: “Still Cheap”
Finally, we arrive at the cool confines of purple, indicating that Bitcoin is “Still Cheap”. It’s an assertion that Bitcoin is undervalued, possibly a hidden gem ripe for investment, presenting a tantalizing risk/reward proposition.
The Bitcoin Rainbow Chart is more than a series of colors. It’s a guide, a map, a compass, aiding traders to navigate the high seas of Bitcoin trading. Understanding each color’s message and how to respond accordingly can help you chart your course in the tempestuous world of cryptocurrencies. From the blaring red alert to the tempting purple proposition, every hue has a part to play in this chromatic symphony of financial strategy. Are you ready to play your part?
Has Crypto Bottomed? Reading the Bitcoin Rainbow Chart
Current Position of the Bitcoin Rainbow Chart
The heartbeat of the crypto market—fluctuating, sometimes unpredictable, yet continually intriguing. One look at the Bitcoin Rainbow Chart and it becomes clear we’re in the midst of a fascinating chapter. The question, of course, is this – has crypto bottomed? To interpret the answer, we must delve into the current position on the chart.
Unraveling the Indicators: Has Crypto Bottomed?
As we hover over the rainbow, what do the colors suggest? Currently, the chart indicates that we are in the “Accumulate” or “Buy” phase. It’s not a fall into the abyss, nor a soaring flight into the heavens. We’re comfortably floating mid-air, poised at a strategic phase where Bitcoin prices are inviting enough to consider accumulation or buying.
But is this the bottom? While it’s not a deafening cry of “Still Cheap”, it’s also a far cry from the glaring “Maximum Bubble Risk”. We’re in a position that suggests there’s room for both upward swings and potential downward corrections, a mixed bag of opportunities and risks.
Expert Opinions and Market Sentiment
The experts’ corner seems to echo the Rainbow Chart’s narrative. Some suggest we’ve already touched bottom and are now on an upward trajectory, while others hint at the possibility of further dips. It’s a divide, reflecting the inherent unpredictability of the crypto market.
The market sentiment also fluctuates between optimism and caution, much like the Bitcoin Rainbow Chart’s colorful spectrum. The buzzword is ‘volatility’, with whispers of possible booms and warnings of potential busts.
Bitcoin’s Current and Future Path: Predictions from the Rainbow Chart
Bitcoin’s Current Position on the Rainbow Chart: A Colorful Analysis
The Bitcoin Rainbow Chart serves as a vibrant barometer for the cryptosphere. At the moment, it resembles the hues of a soothing midday sky. We find ourselves in the “Accumulate” and “Buy” zones, suggesting a tantalizing promise of growth and opportunity. This isn’t a deep dive into the crypto abyss, nor a breathless ascent into the bubble stratosphere. It’s a balanced state of play—encouraging enough to accumulate, yet cautious enough not to incite reckless investment frenzy.
Future Projections: Predicting the Unpredictable
Peering into the future of Bitcoin can be akin to predicting the weather in the tempestuous crypto climate. Nonetheless, if history were to repeat itself and the Rainbow Chart’s past patterns were to hold true, we can make some educated conjectures.
Given Bitcoin’s present positioning in the “Accumulate” and “Buy” phases, and considering its historical trends, a possible upward trajectory could be anticipated. In the past, these phases have often preceded notable price escalations, hinting at the potential for future growth. Yet, as with any financial forecast, it’s essential to balance optimism with prudence. Cryptocurrencies, after all, are known for their capricious nature, and Bitcoin is no exception.
Influencing Factors: The Variables of the Equation
Numerous factors could shift Bitcoin’s future position on the Rainbow Chart, adding multiple dimensions to our prediction puzzle.
Market Sentiment and Global Economy: Market sentiment is a potent force in the crypto universe. Positive sentiment can boost Bitcoin to new highs, while pessimism can plunge it into the depths. Moreover, macroeconomic factors like inflation rates, global financial stability, and regulatory changes can dramatically affect Bitcoin’s trajectory.
Technological Advances: As Bitcoin’s underlying technology—blockchain—evolves, so does the potential for Bitcoin’s growth. Innovations in blockchain technology can bolster Bitcoin’s use-cases and enhance its appeal, potentially pushing it upwards on the Rainbow Chart.
Adoption Rate: The rate at which businesses and consumers adopt Bitcoin also plays a crucial role. The wider the acceptance, the higher the demand, which can drive Bitcoin prices upwards.
In the ever-changing cryptosphere, the Bitcoin Rainbow Chart is like a steady compass guiding us through the highs and lows. It paints a vibrant picture of Bitcoin’s current position and provides clues for potential future movements. Although crypto predictions are far from definitive, the Rainbow Chart’s colorful canvas helps us make sense of the complex Bitcoin puzzle.
But, as any seasoned sailor in the sea of crypto would affirm, expect the unexpected. For in the world of Bitcoin, the only certainty is volatility, making the journey all the more exciting. So, as we chart our course using the Rainbow Chart, let’s remember to enjoy the ride!
Wrapping Up the Rainbow: Decoding Bitcoin’s Bottom
The Bitcoin Rainbow Chart: A Recap of Its Significance
As we conclude our colorful journey through the Bitcoin Rainbow Chart, it’s essential to underscore its importance in deciphering Bitcoin’s complex price trends. Much like a prism breaking down light into its constituent colors, the Rainbow Chart breaks down Bitcoin’s price dynamics into digestible sections.
Whether it’s navigating the perilous “Maximum Bubble Risk” or capitalizing on the lucrative “Still Cheap” phase, the Rainbow Chart equips traders with the insights to strategize effectively. It’s more than just a splash of colors; it’s a powerful tool in any crypto investor’s arsenal, illuminating the often murky waters of the Bitcoin market. traders with the insights to strategize effectively. It’s more than just a splash
Has Crypto Bottomed? The Final Verdict
So, to the million Bitcoin question: Has crypto bottomed? Drawing upon the insights from our Rainbow Chart, current indicators seem to suggest we’re neither at the peak nor the trough. We’re somewhere in the middle, in the “Accumulate” and “Buy” zones, suggesting there’s still potential for movement in both directions.
But remember, this isn’t a definitive verdict. The crypto market is like a living, breathing entity, capable of defying expectations and charting its own unpredictable course. All signs and expert opinions must be viewed as informed conjectures, not unerring predictions.
Navigating the Future: Stay Tuned to the Rainbow
As we look ahead, let the Rainbow Chart be your constant guide. Monitor its shifting colors, understand what they signify, and adjust your strategies accordingly. Be prepared to experience all the colors of the Bitcoin rainbow—from the scorching reds to the calming blues.
Remember, in the volatile landscape of crypto, it’s not just about reaching the destination—it’s also about the journey. And the Rainbow Chart ensures your journey is filled with valuable insights, strategic decisions, and of course, a splash of vibrant colors.
Navigating the crypto seas can be as unpredictable as sailing through a storm, but the Bitcoin Rainbow Chart is your trusty compass, keeping you on course. Whether crypto has bottomed is a question that will continue to intrigue, but one thing is clear—the Rainbow Chart will be there to shed light on the darkest corners of doubt. So, keep charting, keep sailing, and most importantly, keep believing in the captivating allure of Bitcoin.
FAGs
- What is the Bitcoin Rainbow Chart?
A1: The Bitcoin Rainbow Chart is a price chart that applies a color spectrum to Bitcoin’s logarithmic price scale. Each color represents a different price range and conveys a unique market status such as ‘cheap’, ‘buy’, ‘sell’, or ‘bubble’, helping traders understand the current market conditions and make informed investment decisions.
- How can the Bitcoin Rainbow Chart help determine if the crypto has bottomed?
A2: The Bitcoin Rainbow Chart provides a visual representation of Bitcoin’s price trends over time. By examining the color currently represented on the chart, traders can interpret whether Bitcoin’s price is at a low point (bottomed) or not. For instance, if the chart is in the ‘cheap’ or ‘buy’ phase, it may suggest that crypto has bottomed and might be a good time to invest.
- How reliable is the Bitcoin Rainbow Chart for predicting Bitcoin’s future trends?
A3: While the Bitcoin Rainbow Chart is a useful tool for understanding Bitcoin’s past and present price trends, it should not be solely relied upon for predicting future movements. Crypto markets are influenced by a multitude of factors, many of which are unpredictable. Therefore, it’s always important to incorporate a variety of data sources and analysis techniques when forecasting Bitcoin’s future.