
Summary: Bitcoin mining profitability faces mounting pressure as network difficulty reaches record highs while transaction fees remain near historic lows. This comprehensive analysis explores weekly hashprice fluctuations, difficulty adjustment impacts, and strategic hedging approaches that miners can leverage to optimize revenue in volatile market conditions.
Understanding Hashprice Fundamentals in Current Market Conditions
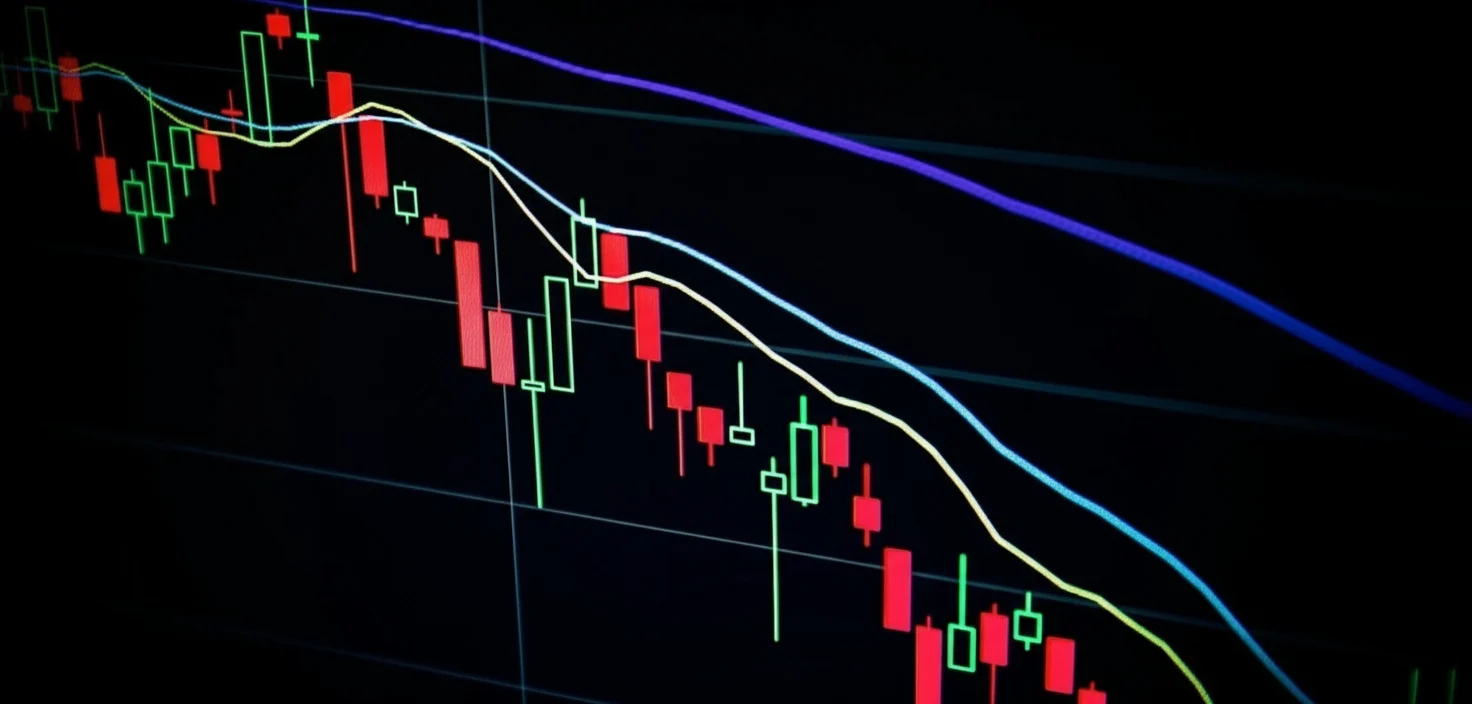
The cryptocurrency mining landscape has entered a challenging phase in late 2025, with Bitcoin trading around $95,000-$101,000 following recent volatility. Network difficulty recently adjusted downward by 2.37% to 152.27T on November 13, 2025, providing miners with temporary relief after months of relentless increases. This rare downward adjustment—only the seventh in 2025—highlights the delicate balance between hashrate deployment and profitability margins.
Key Hashprice Components Driving Profitability
Hashprice represents the expected mining revenue per unit of hashrate per day, calculated from three primary constituents: Bitcoin price action, network difficulty, and transaction fee collection. Understanding how these elements interact is essential for mining operations planning capital deployment and operational strategy.
Current market dynamics show hashprice averaging $40-48 per PH/s/day in USD terms, while BTC-denominated hashprice hovers around 0.00039-0.00042 BTC. These metrics have compressed significantly since mid-2025, primarily driven by aggressive difficulty increases that outpaced price appreciation.

Network Difficulty Dynamics: The Primary Profitability Driver
Bitcoin’s difficulty adjustment mechanism, which recalibrates every 2,016 blocks (approximately two weeks), has proven to be the most significant variable affecting miner revenues. Throughout 2025, the network has experienced predominantly positive adjustments, with difficulty climbing from approximately 135T in mid-2025 to peaks above 155T in October before the recent slight decrease.
Impact of Difficulty on Mining Economics
When network difficulty increases, miners require more computational power to solve blocks, effectively reducing hashprice proportionally. The October 2025 period exemplified this dynamic, with average difficulty increasing 8.4% month-over-month, contributing to a 6.9% decline in USD hashprice and 7.9% drop in BTC-denominated hashprice.
For mining operations, this translates directly to operational margins. Sub-19 J/TH efficiency fleets currently generate approximately $119 per MWh in mining revenues, while less efficient 25-38 J/TH operations earn only $63 per MWh. This efficiency gap underscores the imperative for hardware upgrades to remain competitive.
Reading Difficulty Adjustment Signals
Miners should monitor block time averages as leading indicators for upcoming adjustments. When average block times fall consistently below the 10-minute target—as seen in October with 9 minutes 30 seconds average—positive difficulty adjustments are imminent. This pattern indicates approximately 5.3% excess hashrate relative to network targets, signaling new capacity deployment or improved operational efficiency across the mining ecosystem.

Transaction Fee Environment: The Overlooked Revenue Stream
While block subsidies constitute the majority of mining revenue, transaction fees represent an increasingly important variable component. The current fee environment presents significant challenges, with average collection at 0.022 BTC per block—the lowest level since February 2011 in BTC terms.
Historical Fee Patterns and Current State
Transaction fees have declined 17.9% on a BTC-denominated basis during recent months, constituting only 0.71% of total block rewards compared to historical averages that occasionally exceeded 5-10% during periods of network congestion. This represents a fundamental shift in mining economics that reduces revenue predictability.
In USD terms, fees averaged approximately $2,573 per block in October 2025, down 15.7% from the previous month. This dual compression—both in BTC and USD terms—eliminates what was historically a profitable revenue buffer during difficulty adjustment periods.
Fee Market Outlook and Implications
The sustained low-fee environment reflects reduced on-chain transaction demand, with activity migrating to Layer 2 solutions and alternative networks. For miners, this means greater reliance on block subsidies and increased exposure to difficulty fluctuations. Operations should model profitability scenarios assuming fees remain below 1% of total rewards for the foreseeable future rather than depending on fee surges to offset difficulty increases.
Table 1: Weekly Hashprice Component Breakdown
| Component | Week 1 | Week 2 | Week 3 | Week 4 | Monthly Avg | Change (%) |
|---|---|---|---|---|---|---|
| USD Hashprice ($/PH/s/day) | $51.16 | $52.22 | $47.85 | $44.47 | $48.47 | -6.9% |
| BTC Hashprice (BTC/PH/s/day) | 0.00044 | 0.00043 | 0.00042 | 0.00041 | 0.00042 | -7.9% |
| Network Difficulty (T) | 147.2 | 150.8 | 147.7 | 155.9 | 149.3 | +8.4% |
| Average BTC Price ($) | $116,172 | $121,440 | $114,048 | $109,610 | $114,289 | +1.1% |
| Transaction Fees (BTC/block) | 0.024 | 0.023 | 0.021 | 0.020 | 0.022 | -17.9% |
| Transaction Fees ($/block) | $2,788 | $2,793 | $2,395 | $2,319 | $2,573 | -15.7% |
Source: Mining pool data and blockchain analytics, October 2025

Hardware Efficiency: The Competitive Advantage in Tight Margins
The compression in mining economics has created a stark divide between operations running next-generation equipment and those operating legacy hardware. Energy hashprice—the dollar value earned per megawatt-hour of electricity consumed—varies dramatically based on equipment efficiency.
Efficiency Tier Performance Analysis
Next-generation fleets (<19 J/TH) like the Antminer S21+ series achieve approximately $119 per MWh, providing sustainable margins even at current hashprice levels. Mid-tier equipment (19-25 J/TH) generates $92 per MWh, while older generation machines (25-38 J/TH) struggle at $63 per MWh.
For operations with electricity costs below $0.06 per kWh, next-gen equipment maintains healthy profitability despite difficulty increases. However, miners paying above $0.08 per kWh with older equipment face margin compression that threatens operational viability.
Strategic Hardware Upgrade Considerations
The economic imperative for hardware upgrades has never been stronger. Operations planning expansion should prioritize efficiency over raw hashrate capacity, as each efficiency tier provides fundamentally different revenue-per-watt profiles. The Bitmain Antminer S21 and similar models offer 20-25% better efficiency than previous generations, translating to proportional profitability advantages.
Miners should evaluate the payback period for new equipment considering current hashprice projections. With forward markets pricing hashprice around $40 per PH/s/day through early 2026, upgrading from 28 J/TH to 17 J/TH equipment could deliver 12-18 month payback periods at typical electricity rates, compared to 24-36+ months for older hardware.

Hashrate Forward Markets: Strategic Hedging Tools
The development of sophisticated hashrate derivatives markets provides miners with powerful risk management tools. These financial instruments allow operations to lock in future mining revenues, providing cash flow certainty and enabling non-dilutive financing strategies.
Forward Contract Mechanics
Hashrate forward contracts enable miners to sell future mining production at predetermined prices, hedging against the risk of declining hashprice due to difficulty increases or price volatility. Contracts are available in both USD-denominated and BTC-denominated formats, each serving distinct strategic purposes.
USD-denominated contracts provide certainty in operational currency, protecting against hashprice declines in dollar terms. Recent data shows that miners who sold October 2025 contracts 3-5 months in advance outperformed spot mining by 4-18%, locking in hashprices of $50-57 per PH/s/day versus actual settlement at $48.47.
BTC-denominated contracts maintain bitcoin price exposure while hedging against difficulty increases and fee variability. October 2025 sellers who entered contracts 2-3 months early earned 12-15% more BTC than spot miners, effectively neutralizing the impact of difficulty compression while retaining upside from price appreciation.
Rolling Hedge Strategy Performance
Analysis of rolling hedge strategies from October 2024 through October 2025 reveals that BTC-denominated hedging significantly outperformed spot mining, with 4-5 month forward positions generating +7-10% additional BTC revenue. This performance resulted from contracts priced before the accelerated difficulty increases that characterized 2025.
Conversely, USD-denominated hedging underperformed by approximately -5% during the same period due to Bitcoin’s price appreciation from $40,000 levels to above $100,000. This underscores the importance of matching contract denomination to strategic objectives—USD contracts for operational stability, BTC contracts for maintaining coin accumulation goals.
Table 2: Hedging Strategy Performance Comparison
| Strategy Type | Hedge Horizon | Avg. Outperformance vs. Spot | Best Month | Worst Month | Recommended For |
|---|---|---|---|---|---|
| BTC 1-Month Forward | 1 month | +4.2% | +7.8% | +1.2% | Conservative BTC accumulators |
| BTC 3-Month Forward | 3 months | +12.5% | +15.2% | +8.9% | Aggressive difficulty hedgers |
| BTC 5-Month Forward | 5 months | +9.9% | +14.7% | +4.1% | Long-term planning operations |
| USD 1-Month Forward | 1 month | +3.1% | +14.3% | -8.2% | Operations with USD obligations |
| USD 3-Month Forward | 3 months | -1.8% | +18.0% | -15.4% | Price-sensitive budgeting needs |
| USD 5-Month Forward | 5 months | -4.9% | +11.2% | -22.6% | Not recommended during bull markets |
Source: Hashrate derivative market data, October 2024-October 2025
Market Outlook: Forward Curves Signal Near-Term Challenges
Forward hashrate markets provide valuable insights into collective miner expectations for future network conditions. Current forward curves for November 2025 through March 2026 reveal mixed sentiment that miners should incorporate into planning.
USD Forward Curve Analysis
USD-denominated forwards have declined 14-20% across the November 2025-March 2026 timeframe, signaling market expectations for continued profitability compression. Front-month contracts trade around $40-42 per PH/s/day, with the curve in backwardation—indicating higher near-term prices than longer-dated contracts, a bearish structural signal.
This forward curve shape suggests miners expect either continued difficulty increases, declining Bitcoin prices, or both. Operations should plan for scenarios where hashprice remains compressed in the $38-44 range rather than anticipating near-term recovery to the $50+ levels seen in mid-2025.
BTC Forward Curve Insights
BTC-denominated forwards show more nuanced dynamics. Front-end contracts (November 2025-January 2026) declined 1-5%, while tail-end contracts (February-March 2026) actually increased 1-3%. This pattern implies expectations for near-term network-side pressure (difficulty increases) followed by potential relief—possibly from hashrate curtailment, slower equipment deployment, or improved fee conditions.
Implied Difficulty and Hashrate Expectations
By analyzing the relationship between USD and BTC forward curves while assuming transaction fee levels, we can extract implied difficulty expectations. Current markets suggest difficulty may increase approximately 3-5% through January 2026 before potentially stabilizing or declining slightly in Q1 2026.
Implied network hashrate expectations range from 1,120 EH/s currently to approximately 1,170-1,200 EH/s by early 2026, representing 4-7% growth over the next 3-4 months. This projected growth rate is notably slower than the 8-10% monthly increases experienced through mid-2025, suggesting equipment deployment may be moderating as marginal operations face profitability challenges.
Operational Strategies for Navigating Volatility
Successful mining operations in the current environment require multi-dimensional strategic approaches combining hardware optimization, energy cost management, and financial hedging.
Portfolio Approach to Revenue Stabilization
Rather than choosing exclusively between spot mining and hedging, sophisticated operations implement portfolio approaches that allocate production across multiple strategies. A typical balanced approach might allocate:
- 40-50% to spot mining to maintain Bitcoin exposure and benefit from potential upside surprises
- 30-40% to 1-3 month BTC-denominated forwards to neutralize near-term difficulty risk
- 10-20% to longer-dated (4-6 month) forwards to secure baseline revenue floors
This diversified approach provides downside protection while maintaining meaningful upside participation, avoiding the regret scenarios where miners are either completely unhedged during difficulty spikes or fully hedged during price rallies.
Energy Cost Optimization
With hashprice compression making electricity costs the dominant operational expense, energy procurement strategy has become equally important as hardware selection. Operations should explore:
- Power purchase agreements (PPAs) that fix electricity costs for 1-3 year periods, creating known cost structures
- Interruptible load programs that provide discounted electricity in exchange for curtailment rights, enabling profitable operation at lower effective costs
- Strategic geographic positioning in regions with structural electricity cost advantages, such as stranded gas locations or renewable energy zones with excess capacity
Financing Hashrate for Fleet Expansion
Hashrate forward contracts with upfront payment structures enable non-dilutive financing for equipment upgrades. In this model, miners receive immediate capital in exchange for committing future production, with the spread between deliverable forwards (with upfront payment) and non-deliverable forwards representing the effective interest rate on hashrate-backed lending.
Recent markets have priced this financing at 8-13% annualized, competitive with traditional mining equipment loans while avoiding equity dilution or restrictive covenants. For operations with strong operational track records, this financing mechanism can accelerate fleet modernization without impacting ownership structure.

Frequently Asked Questions
Q: How often does Bitcoin mining difficulty adjust, and when is the next change expected?
Bitcoin difficulty adjusts every 2,016 blocks, approximately every two weeks. The next adjustment is estimated for November 26, 2025, with current projections suggesting a potential +2.7% increase to approximately 156.4T based on recent block time trends. Miners can monitor real-time estimates at difficulty tracking tools that calculate expected adjustments based on current block production rates.
Q: What is the minimum efficiency required for profitable Bitcoin mining in late 2025?
Profitability depends on electricity costs, but as a general guideline: Sub-20 J/TH equipment remains profitable at most electricity rates below $0.08/kWh, while equipment above 25 J/TH faces margin compression at costs above $0.06/kWh. With hashprice around $40-48/PH/s/day and difficulty at 152T+, operations should target efficiency below 18-19 J/TH for sustainable long-term profitability.
Q: Should I use USD or BTC-denominated forward contracts for hedging?
The choice depends on your strategic objectives. BTC-denominated contracts are optimal for operations focused on accumulating bitcoin while hedging against difficulty increases, as they maintain price exposure. USD-denominated contracts suit operations with dollar-denominated obligations (debt service, operating expenses) requiring cash flow certainty regardless of Bitcoin price movements. Many operations use both types strategically.
Q: How do I calculate my energy hashprice to evaluate hardware upgrade decisions?
Energy hashprice equals (Daily Mining Revenue per TH) × (1 TH / Equipment Joules per TH) × (1,000,000 W per MW) × (24 Hours per Day). For example, at $48/PH/s/day hashprice, 17 J/TH equipment generates: $0.000048 × (1/17) × 1,000,000 × 24 = $67.76 per MWh. Compare this to your all-in electricity cost to determine profitability margins.
Q: Are we currently in a bull or bear market for mining, and what’s the outlook for 2026?
The mining market is experiencing challenging consolidation rather than a clear bull or bear phase. While Bitcoin prices remain elevated in historical terms ($95,000-$101,000), mining-specific metrics show compression from difficulty increases and low fees. The outlook for early 2026 suggests continued volatility with potential difficulty growth moderation, making this a period favoring efficient operations with strong balance sheets over marginal producers.
Ready to optimize your mining operation? Explore high-efficiency mining hardware like the Antminer S21+ series, Whatsminer M50 series, and Avalon Made miners at competitive prices. For strategic consultation on hashrate hedging and operational optimization, contact our mining specialists at Miners1688 who provide expert guidance tailored to Western mining operations.
Disclaimer: This analysis is for informational purposes only and does not constitute investment, financial, or mining operation advice. Cryptocurrency mining involves significant risks including hardware obsolescence, electricity cost volatility, network difficulty changes, and price fluctuations. Past performance of hedging strategies does not guarantee future results. Consult with qualified financial and technical advisors before making mining investment or operational decisions.